
Canva is a versatile and user-friendly graphic design platform that empowers users to create stunning infographics without the need for extensive design skills. Whether you're a beginner or a design enthusiast, this step-by-step tutorial will guide you through the process of crafting impressive infographics using Canva.
Step 1: Sign Up and Log In
- Visit the Canva website (www.canva.com) and sign up for a free account if you don't have one.
- Log in to your Canva account to access the design platform.
Step 2: Start a New Project
- Once you're logged in, click on the "Create a design" button located on the top right corner.
- In the search bar, type "infographic" and select the "Infographic" template.
Step 3: Choose a Template
- Canva offers a wide range of professionally designed infographic templates. Browse through the options and choose a template that fits your content and style.
Step 4: Customize Your Infographic
- Customize the template by clicking on different elements such as text, images, icons, and backgrounds.
- To edit text, simply click on the text box and replace the placeholder text with your content. You can adjust font styles, sizes, colors, and alignment using the text editing options.
- Replace template images with your own by clicking on them and uploading your desired images from your computer or Canva's library.
- Explore the "Elements" tab on the left panel to add icons, shapes, lines, and illustrations to enhance your infographic.
Step 5: Add Icons and Graphics
- Click on the "Elements" tab and select the "Icons" category to access a wide variety of icons and graphics.
- Search for specific icons related to your content and drag them onto your infographic. Resize, rotate, and position them as needed.
Step 6: Incorporate Data Visualizations
- Canva provides tools to create simple data visualizations such as bar charts, pie charts, and more.
- Click on the "Charts" option in the "Elements" tab, choose the chart type you want, and input your data. The chart will automatically update based on your data.
Step 7: Customize Colors and Themes
- Click on the "Colors" tab on the left panel to choose a color palette that matches your content or brand.
- You can also explore different themes in the "Templates" tab to quickly change the overall look of your infographic.
Step 8: Arrange and Align Elements
- Use the drag-and-drop feature to rearrange elements within your infographic.
- The alignment tools located at the top of the design workspace help you ensure that elements are evenly spaced and aligned.
Step 9: Preview and Download
- Click on the "Preview" button to see how your infographic looks before finalizing.
- If you're satisfied with the design, click on the "Download" button at the top-right corner.
- Choose the format you want (JPEG or PNG) and the desired quality.
Step 10: Share and Showcase
- Once downloaded, your infographic is ready to be shared on social media, websites, presentations, or printed materials.
- Ensure that your infographic effectively communicates your message and provides credit for any images or data used.
Canva simplifies the process of creating visually appealing infographics, making it accessible to individuals with various design backgrounds. By following this tutorial, you can tap into the creative potential of Canva to design engaging and impactful infographics that capture your audience's attention.
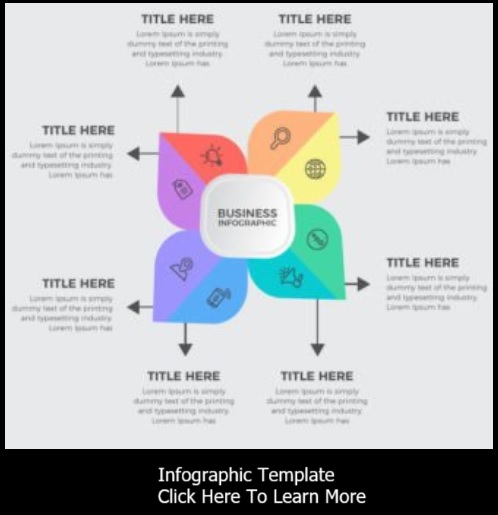
- A Step-by-Step Guide to Creating an Infographic Template
- Crafting Compelling Infographics with Adobe Illustrator: A Step-by-Step Guide
- Crafting Infographics with Adobe Spark Post
- Creating Infographics Using Google Docs: A Creative Approach
- Creating Infographics with Photoshop
- Creating Informative Infographics with Google Charts
- Creating Stunning Infographics with PowerPoint: A Step-by-Step Tutorial
- Designing Infographics with Canva
- Empowering Creativity: Exploring Free Online Infographic Makers
- Transforming an Article into an Engaging Infographic: A Step-by-Step Guide