
Google Charts is a powerful and user-friendly tool that allows you to create dynamic and visually appealing data visualizations. Infographics designed using Google Charts can effectively convey complex information in an engaging and easily understandable manner. In this tutorial, I'll guide you through the process of using Google Charts to craft informative infographics.
Step 1: Access Google Charts
- Open your web browser and go to the Google Charts website: https://developers.google.com/chart.
- Explore the available chart types and examples to get a sense of what you can create.
Step 2: Choose a Chart Type
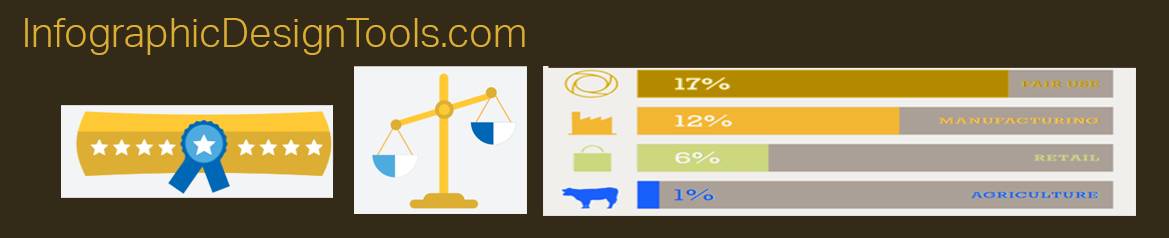
- Decide on the type of chart that best suits your infographic's content. Google Charts offers a variety of options, including bar charts, line charts, pie charts, and more.
Step 3: Prepare Your Data
- Organize your data in a structured format. Most Google Charts require data in the form of tables or arrays.
Step 4: Customize the Chart
- Visit the "Chart Gallery" on the Google Charts website and select the specific chart type you want to use.
- Within each chart's documentation, you'll find customizable options such as colors, labels, titles, and data formatting.
Step 5: Embed the Chart
- Once you've customized the chart to your liking, use the provided code snippet to embed the chart in your HTML document or website.
- If you're not comfortable with coding, you can also use Google Sheets to create and embed charts using the built-in charting functionality.
Step 6: Enhance the Infographic
- To create a complete infographic, you can combine multiple Google Charts on a single page.
- Add text, headings, and icons to provide context and enhance the visual appeal of your infographic.
Step 7: Publish and Share
- Once you're satisfied with your infographic, publish it on your website, blog, or social media platforms.
- Consider using Google Sites, Blogger, or other platforms to showcase your infographic alongside relevant content.
Tips for Effective Use of Google Charts:
-
Choose the Right Chart: Select a chart type that best represents your data and effectively communicates your message.
-
Keep It Simple: Avoid clutter by focusing on the key data points and minimizing unnecessary elements.
-
Use Colors Thoughtfully: Opt for a cohesive color scheme that matches your brand or the infographic's theme.
-
Provide Context: Include a title, labels, and legends to help viewers understand the chart's content.
-
Responsive Design: Ensure that your embedded charts are responsive and adjust well to different screen sizes.
-
Check Compatibility: Test your infographic on various devices and browsers to ensure compatibility and optimal viewing experience.
Step 8: Maintain Data Accuracy
- Regularly update your infographic to reflect the most current and accurate data.
Creating infographics with Google Charts is a great way to present data-driven stories, share insights, and engage your audience. By following this tutorial, you'll be able to harness the capabilities of Google Charts to design visually compelling and informative infographics that capture attention and convey information effectively.
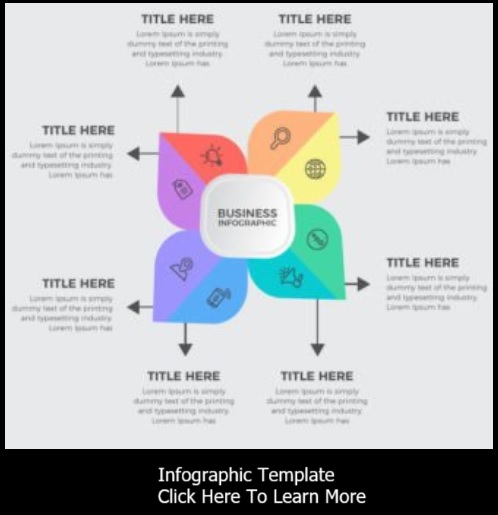
- A Step-by-Step Guide to Creating an Infographic Template
- Crafting Compelling Infographics with Adobe Illustrator: A Step-by-Step Guide
- Crafting Infographics with Adobe Spark Post
- Creating Infographics Using Google Docs: A Creative Approach
- Creating Infographics with Photoshop
- Creating Informative Infographics with Google Charts
- Creating Stunning Infographics with PowerPoint: A Step-by-Step Tutorial
- Designing Infographics with Canva
- Empowering Creativity: Exploring Free Online Infographic Makers
- Transforming an Article into an Engaging Infographic: A Step-by-Step Guide